Thursday, June 28, 2012

What we learn to do, we learn by doing (Aristotle)

I challenged myself at ISTE this past week. I was determined to actually put a couple of tools into practice, and give them an honest shot to see if they made sense for my style and the work that I do. I've had Twitter and Evernote accounts for ages, but I've never really connected with either technology. Of course, that might be because I've never really given either tool a real chance!

At the opening keynote, I tapped into the ISTE hashtag (#iste12), and watched the tweets come in. I responded to someone, and I tweeted a few speaker comments I found interesting or provocative. I figured if nothing else, this would be a way for me to get back to some quotes I might want to use in my own work. Then I got lucky. Someone tweeted a link to an article about how to use Twitter at a conference, and my eyes were opened. Of course, I can't find the link or the tweet now, but I'll try to summarize.


Twitter is most commonly used for people to share quotes from speakers at conferences. Like me, many people use this as a sort of mental reminder of what happened, and what spoke to them. A second way to use Twitter at a conference is to share additional resources. If a presenter is talking about a particular tool or website, one might tweet the URL or related info to a group under a specific hashtag. A third way is to share notes; clearly taking notes in twitter doesn't make sense, but if you take notes in another tool, you might tweet the URL of your notes so that others either in the session or not have access to what you captured.

And that leads to the second tool I actually tried out at the conference, Evernote. I took notes in a couple of different ways, using my phone to capture slides (didn't care for it), and taking detailed notes about topics I was very invested in. That worked for me. I then made the notes public, tweeted a link, and all of my followers (yes, all 26 of them) could see what I had written. I could also share my Evernote notebook via email, which worked well for colleagues that don't use Twitter regularly. They got access to all of the notes I took in that notebook, and were able to get at least a limited experience with the conference despite not being there.

So, my conclusion? I really enjoyed using Twitter. I don't know that I'll be good about using it regularly, but I'll keep trying. At least at conferences, I feel like it worked well for me. Evernote, however, is going to be a regular part of my repertoire. I like it much better than Google Docs for note-taking, better than Diigo for collecting/annotating resources, and I think it will be a great shared research tool. I see it being extremely helpful in the courses I'm taking this next year, as I know I will have a ton of information to collect and organize.

One more tool - I heard about TubeChop at a session, and got the opportunity to use it today. ISTE recorded the entire keynote session, but I wanted to share only the part where Dr. Yong Zhao was speaking. So I used TubeChop to get the piece I wanted, and then I tweeted it!

Monday, June 18, 2012

Web 2.0 Tools in the Classroom


One activity I used to do with 5th and 6th grade students was to have them create movie-style posters to advertise novels that they read. They had to analyze tone and theme for the colors and images they selected. They also had to identify a short phrase or a few key words that would "grab" the audience, while remaining true to the theme of the story. Back in the olden days we used images cut from magazines - now with the web at our fingertips it's time to take this activity online!

Assignment: Book Trailers using Animoto
Outcome: Create a 30-second video that uses image, text and music to faithfully represent the theme of a novel.
Standards: analyze theme of narrative works, use multimedia components in presentations to clarify information and add interest.

In this activity, students will first analyze a novel they have chosen for theme and tone. They will identify the literary elements used by the author to progress the action or plot, and will select a small number of short phrases or words from the text that capture the essence of the story's theme. Next, students will select Creative Commons licensed and/or copyright friendly images to show some key elements of the story, consistent with the analysis they have already completed. Finally, they will upload images into Animoto, add their selected text, and select a music track that is consistent with their novel. The final product is a short "book trailer" that will encourage others to read their novel.

I think that by starting with the analysis, before there is any discussion of the technology to be used, students will focus better on the concept of theme. Once they have identified the theme, I might potentially scaffold the assignment by asking students questions such as, "what does 'suspense' look like or sound like?" Knowing that they will eventually have to sell the book to the rest of their classmates is generally a good motivation for students this age - having a survey or  +1 next to each published final product might be a good peer review strategy, particularly if the Animoto videos are not linked to a student name.

One possible extension to this activity is to identify the antithesis to the theme of the novel, and create a book trailer for the anti-novel. While it's not made in Animoto, Scary Mary does a nice job of showing how to turn a theme on its head!

Friday, June 1, 2012

Seeing the Past


photo of stele of Code of Hammurabi, on display at the Louvre
I recently got back from Paris, where of course I visited the Louvre. While I loved the Mona Lisa and the Renaissance artists, it was the antiquities wing that really lit my fire. To see cuneiform in real life, as written thousands of years ago; to stand in front of the Code of Hammurabi (yes, the real actual stele with the Code carved in it); to marvel at the paint that remains on the 15 foot tall stone carvings of Sargon - I was in heaven!

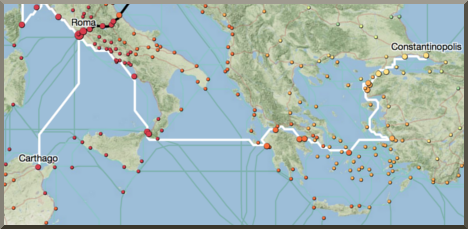
So I guess I was primed when today I read about ORBIS (http://orbis.stanford.edu/), a research and visualization tool produced by Stanford. According to the site, ORBIS "reconstructs the time cost and financial expense associated with a wide range of different types of travel in antiquity." The blogs I read spoke of its value as a research tool in the humanities, but my first thought was how it could bring the realities of ancient civilizations to life for 6th grade students!

When I taught 6th grade, I used to have students do chart paper and pencil simulations of conditions in the ancient world. They would read about climate, geography, food sources and military campaigns, and try to make sense of how those related. But I didn't have access to Google Earth at that time to show them the terrain, and I certainly didn't have access to research-based information about how long it took to get from Point A to Point B via military march, pack train, or horse relay!

map from ORBIS showing route from Rome to Constantinople
ORBIS Screenshot - http://orbis.stanford.edu
In addition, ORBIS has an interactive distance cartogram feature that uses visual data representation to show travel time and cost to various cities in summer and winter. Despite knowing little about data disaggregation and even less about the research that went into this sort of visualization, I immediately knew I could use this map to help students understand why Rome was the heart of the Roman Empire based on its geography, which facilitated economic and military capabilities. Want to know why London found it difficult to break away from the Roman Empire? Check out the cost and time involved in getting grain in the winter, and think about possible correlations.

It is SO difficult for students to really picture the challenges faced by earlier civilizations. In the 90's, we used software like Oregon Trail, and paper simulations that used pushpins on a chart paper map and "event cards" that proposed scenarios. While those simulations helped, they were time consuming and difficult to adapt. ORBIS allows students to play with the data, exploring a variety of options and strategies. Students can then apply their research skills and use other tools such as Google Earth to think critically about the "why" of the numbers. I hope that Stanford researchers decide that ancient Egypt, India, or the Far East would make a good next project...

This almost makes me want to go back to 6th grade!