I recently got back from Paris, where of course I visited the Louvre. While I loved the Mona Lisa and the Renaissance artists, it was the antiquities wing that really lit my fire. To see cuneiform in real life, as written thousands of years ago; to stand in front of the Code of Hammurabi (yes, the real actual stele with the Code carved in it); to marvel at the paint that remains on the 15 foot tall stone carvings of Sargon - I was in heaven!
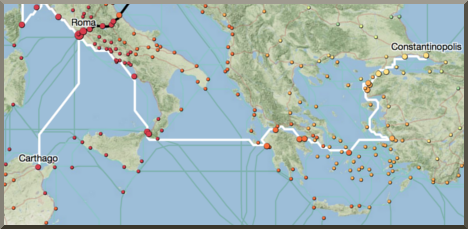
So I guess I was primed when today I read about ORBIS (http://orbis.stanford.edu/), a research and visualization tool produced by Stanford. According to the site, ORBIS "reconstructs the time cost and financial expense associated with a wide range of different types of travel in antiquity." The blogs I read spoke of its value as a research tool in the humanities, but my first thought was how it could bring the realities of ancient civilizations to life for 6th grade students!
When I taught 6th grade, I used to have students do chart paper and pencil simulations of conditions in the ancient world. They would read about climate, geography, food sources and military campaigns, and try to make sense of how those related. But I didn't have access to Google Earth at that time to show them the terrain, and I certainly didn't have access to research-based information about how long it took to get from Point A to Point B via military march, pack train, or horse relay!
 |
| ORBIS Screenshot - http://orbis.stanford.edu |
It is SO difficult for students to really picture the challenges faced by earlier civilizations. In the 90's, we used software like Oregon Trail, and paper simulations that used pushpins on a chart paper map and "event cards" that proposed scenarios. While those simulations helped, they were time consuming and difficult to adapt. ORBIS allows students to play with the data, exploring a variety of options and strategies. Students can then apply their research skills and use other tools such as Google Earth to think critically about the "why" of the numbers. I hope that Stanford researchers decide that ancient Egypt, India, or the Far East would make a good next project...
This almost makes me want to go back to 6th grade!

No comments:
Post a Comment